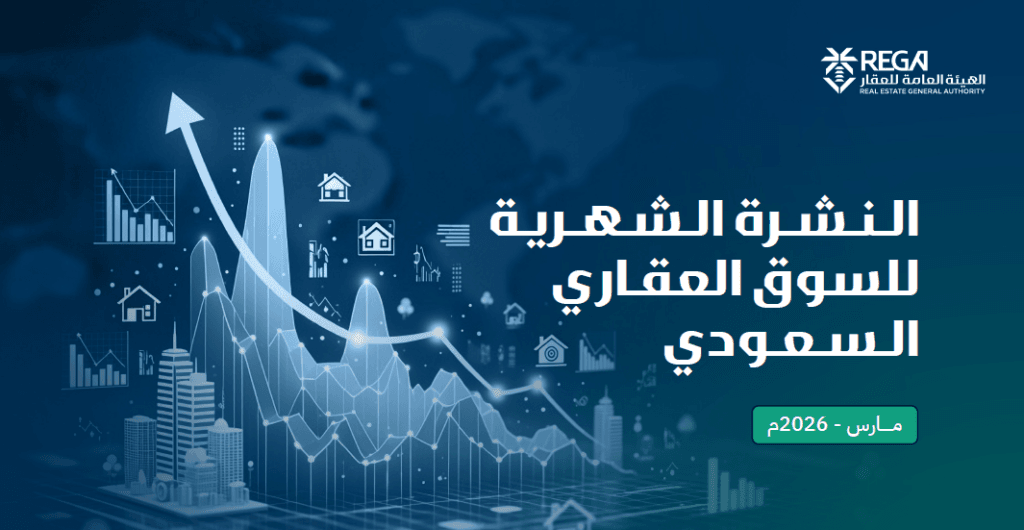

بين تباطؤ الصفقات وانخفاض القيم وتراجع الإعلانات، تكشف نشرة الهيئة العامة للعقار لشهر مارس
First: The decline in real estate transaction activity (sale of assets)
The data indicates that the activity of real estate transactions declined during March 2026 on both monthly and annual levels. The number of residential transactions fell to 14,222, a monthly decrease of 22% and an annual decrease of 52%. The number of non-residential transactions fell to 1,500, down 30% monthly and 52% yearly.
Non-residential transactions also fell to 1,500, down 30% monthly and 52% yearly.
At the value level, the value of residential transactions amounted to about 12.03 billion riyals, down 18% monthly and 67% annually, while the value of non-residential transactions amounted to about 7.34 billion riyals, down 22% monthly and 60% annually.
As for the average area traded, it was recorded in the residential sector about 408 square meters, a slight decrease of 1% monthly and 5% yearly, while the average non-residential area reached about 27,219 square meters, a monthly decrease of 35% with relative stability on a yearly basis.In terms of the average transaction value, it relatively stabilized in the residential sector at about 741 thousand riyals, down 2% monthly and 5% year-on-year, while in the non-residential sector it increased to about 2.62 million riyals with a monthly growth of 6%.
With regard to the average transaction value, it was relatively stable in the residential sector.
Second: Decline in Rental Market Activity
The data indicates a monthly decline in rental market activity during March 2026 compared to February, versus relative stability year-on-year.
The number of residential leases decreased to 181,951 contracts, down 32% monthly, while the number of non-residential contracts reached 46,737 contracts, down 29%. This was attributed to the high frequency of documentation during the previous period associated with regulatory provisions between landlord and tenant.
Year-on-year, residential contracts recorded a slight increase of 1% versus a limited decline of 2% for non-residential contracts.
The number of rental transactions decreased to 205,466 residential transactions, down 39%, and 69,320 non-residential transactions, down 35%, with limited year-on-year changes.
The number of rental transactions decreased to 205,466 residential transactions, down 39%, and 69,320 non-residential transactions, down 35%, recording limited year-on-year changes.
In terms of value, the value of residential rental transactions amounted to 4.06 billion riyals, down 42% per month, while non-residential transactions amounted to 3.60 billion riyals, down 38%, with continued year-on-year growth of 7% for residential and 6% for non-residential.
Residential rental transactions amounted to 4.06 billion riyals, down 42% per month.
Third: Performance of the residential sector (sales by types)
The data shows a continued decline in the number of residential transactions during March 2026 compared to the same period of the previous year.<Land transactions fell to 7,720, down 59%, apartments fell to 3,529, down 43%, villas fell to 1,277, down 36%, and duplexes fell to 641, down 19%.On a monthly basis, land transactions fell by 27%, apartments by 23%, while villas stabilized at levels close to the previous month.
In terms of value, land transactions amounted to about SAR 5.87 billion, down 76% year-on-year, apartments SAR 2.37 billion, down 48%, and villas SAR 1.94 billion, down 61%.
The value of land transactions amounted to about SAR 5.87 billion, down 76% year-on-year.
Fourth: Areas and average value of residential transactions
Some types witnessed a limited improvement in value on a monthly basis, with the value of “Al Dur” transactions increasing by 5% compared to the previous month.
The average traded areas were relatively stable in most types, with the average area of lands reaching about 554 square meters, apartments 163 square meters, and villas 423 square meters, with slight changes.
In terms of average transaction value, some types recorded monthly improvement, with the average transaction value of "houses" rising by 6% and apartments by 3%, while land continued to decline by 11%.
The average value of "houses" increased by 6% and apartments by 3%, while land continued to decline by 11%.
Fifth: Geographical Distribution of Real Estate Transactions (Sale)
The Riyadh region led the number of real estate transactions with 30% and 4,773 transactions, followed by the Makkah region with 20% and 3,143 transactions, then the Eastern region with 16% and 2,504 transactions.
The Qassim region recorded 1,278 transactions with 8%, and Medina 747 transactions with 5%.In terms of value, Riyadh also topped the list with more than 9.38 billion riyals worth 48%, followed by Mecca with 26% worth 4.97 billion riyals, then the Eastern Province with 12% worth 2.36 billion riyals, while Medina and Qassim recorded lower percentages of 4% and 2%, respectively.
Sixth: Geographical distribution of rental transactions
Riyadh led the number of rental transactions with a share of 32% with 88,397 transactions, followed by Mecca with 24% with 66,572 transactions, and the Eastern Province with 17% with 47,399 transactions.
Medina and Asir recorded close shares of 5% each.In terms of value, Riyadh also topped with 3.21 billion riyals worth 42%, followed by Mecca with 26% worth 1.97 billion riyals, then the Eastern Province with 14% worth 1.08 billion riyals, with lower percentages for Medina and Asir.
Riyadh also topped with 3.21 billion riyals worth 42%.
VII: Real Estate Brokerage Licenses and Activities
The data indicates that the performance of real estate brokerage licenses varied during March 2026.
Property management licenses stabilized at 71 licenses with no monthly change with an annual growth of 6%, while facilities management licenses decreased to 11 licenses, down 27% monthly and 31% annually.<Brokerage and marketing licenses fell to 2,989 for individuals, down 15%, and 1,235 for establishments, down 22%, with a slight year-on-year decline.
In the real estate consulting and analysis activity, the number of licenses for individuals reached 8, down 27%, while establishments recorded no licenses during the month.
In the real estate auction activity, establishments" licenses decreased to 34, down 15% monthly and 44% yearly.
Real estate auctions activity, establishments” licenses decreased to 34, down 15% monthly and 44% yearly.
VIII: Real estate brokerage contracts
Brokerage contracts decreased significantly during March 2026, as individual contracts in sales brokerage decreased to 160 contracts, down 41% per month and 23% per year, and enterprise contracts decreased to 137 contracts, down 43% per month and 41% per year.In leasing brokerage, contracts amounted to 140 contracts for individuals and 179 contracts for establishments, recording monthly declines, along with an annual decline for establishments.
Marketing brokerage contracts fell to 1,005 contracts for individuals and 7,747 contracts for establishments, with significant monthly declines.
Marketing brokerage contracts fell to 1,005 contracts for individuals and 7,747 contracts for establishments, with significant monthly declines.
Ninth: Decline in real estate advertisements
The data indicates a significant decline in real estate advertisements during March 2026 compared to the previous month. On an annual basis, the number of sales advertisements decreased to 12,152, down 46% monthly and 24% yearly, and rental advertisements decreased to 14,075, down 27% monthly and 13% yearly.
Ninth: Real estate advertisements declined.
X: Data Sources and Methodology Rental sector data is based on official data derived from the "Ejar" network, according to what is documented and registered during the same period.
Data on brokerage activities, licenses and advertisements are based on official data from the Real Estate Brokerage Program of the General Real Estate Authority. Data on brokerage activities, licenses and advertisements are based on official data derived from the Real Estate Brokerage Program of the General Real Estate Authority.
The real estate asset trading (sale) data is based on official data issued by the Ministry of Justice and the Real Estate Registry in the Kingdom of Saudi Arabia, according to what is documented and registered during the reporting period.
The rental sector data is based on official data derived from the "Ejar" network, according to what is documented and registered during the same period.
The processing methodology is based on calculating averages based on the data of the month being measured plus the data of previous months, excluding extreme values according to specific criteria, and excluding any aggregation of less than five transactions.