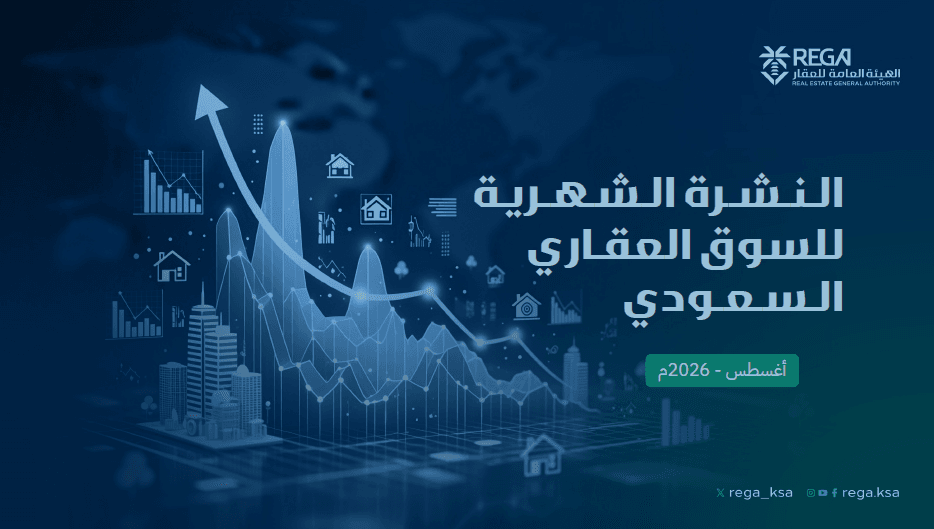

Saudi real estate market indicators during August 2026 revealed mixed movements between sales and rental activity, with a decline in the trading of real estate assets designated for sale, in contrast to a clear growth in rental market activity, coinciding with varying changes in the number of licenses, contracts and real estate advertisements.
The General Authority for Real Estate’s report for August 2026 showed a decrease in the number and value of residential and non-residential transactions compared to July 2026 and August 2025, while rental activity recorded growth in the number of contracts and transactions, while the values of residential and non-residential rental transactions remained stable on a monthly basis with an annual increase.
The data also shows that a large part of the real estate activity continues to be concentrated in a limited number of administrative regions, as Riyadh, Makkah, the Eastern Province, Qassim and Madinah accounted for the largest share of total transactions and their value during August, while Riyadh also led the rental activity in terms of the number of transactions and their value.
Real estate asset trading declined in August
Real estate market data showed a decline in real estate asset trading during August 2026 compared to July 2026, as well as on an annual basis compared to August 2025.
The number of residential real estate transactions during August 2026 reached approximately 21,840 transactions, a decrease of 4% on a monthly basis and 7% on an annual basis, compared to 22,837 transactions in July 2026 and 23,491 transactions in August 2025. As for non-residential real estate transactions, their number reached 2,190 transactions during August 2026, a monthly decrease of 5% and an annual decrease of 4%, compared to 2,314 transactions in July 2026 and 2,279 transactions in August 2025.
In terms of transaction value, residential transactions amounted to approximately 17.90 billion riyals during August 2026, a decrease of 10% on a monthly basis and 8% on an annual basis, compared to 19,816,963,079 riyals in July 2026 and 19,562,588,494 riyals in August 2025.
Non-residential transactions recorded a value of approximately 6.51 billion riyals, declining by 59% on a monthly basis and by 29% on an annual basis, compared to 15,718,425,814 riyals in July 2026 and 9,131,877,860 riyals in August 2025.
Traded areas and average transaction value
The decline in activity was reflected in the average traded area in the real estate market. The average traded area of residential assets reached approximately 408 square meters during August 2026, a decrease of 31 TP3T on a monthly basis and 11 TP3T on an annual basis, compared to 419 square meters in July 2026 and 413 square meters in August 2025.
The average traded area of non-residential assets was approximately 28,908 square meters in August 2026, declining by 10% per month and 9% per year, compared to 31,995 square meters in July 2026 and 31,696 square meters in August 2025.
Regarding the average transaction value, the average residential transaction decreased to approximately 686,000 riyals, with a monthly decrease of 4% and an annual decrease of 8%, compared to 715,004 riyals in July 2026 and 745,857 riyals in August 2025.
In contrast, the average value of a non-residential transaction rose to about 2.07 million riyals during August, with a monthly growth of 2%, despite a yearly decline of 16%, compared to 2,030,626 riyals in July 2026 and 2,462,010 riyals in August 2025.
The rental market is experiencing significant growth.
On the other hand, the rental market showed a different performance during August 2026, with the number of residential and non-residential rental contracts and deals increasing compared to the previous month and the previous year.
The number of residential lease contracts reached 309,032 contracts during August 2026, with a monthly increase of 9% and an annual increase of 35%, compared to 284,044 contracts in July 2026 and 229,565 contracts in August 2025.
The number of non-residential lease contracts also increased to 72,887 contracts, with a monthly growth of 1% and an annual growth of 43%, compared to 71,906 contracts in July 2026 and 51,104 contracts in August 2025.
In terms of the number of rental transactions, the number of residential transactions rose to 343,723 transactions during August, with a monthly growth of 9% and an annual growth of 36%, compared to 315,853 transactions in July 2026 and 252,703 transactions in August 2025.
The number of non-residential transactions also increased to 102,580 transactions, with a monthly growth of 1% and an annual growth of 42%, compared to 102,069 transactions in July 2026 and 72,475 transactions in August 2025.
Rental transaction values are stable on a monthly basis and increase annually.
Regarding the value of rental transactions, the value of residential transactions remained stable at approximately 5.59 billion riyals during August 2026 without any monthly change, while it increased by 28% on an annual basis, compared to 5,588,078,181 riyals in July 2026 and 4,347,523,317 riyals in August 2025.
The value of non-residential transactions also remained stable at around 5.03 billion riyals with no monthly change, while it increased by 37% on an annual basis, compared to 5,012,487,701 riyals in July 2026 and 3,679,998,382 riyals in August 2025.
The Real Estate Authority report explained that the number of lease contracts represents the number of lease contracts during the calculation period regardless of the number of real estate units included in the contract, while the number of lease transactions represents the number of real estate units included in the lease contracts, with each unit being counted as an independent transaction.
Land leads residential trading
When breaking down the trading of residential real estate assets by asset type, land led the activity during August 2026 with 11,653 transactions, down 5% on a monthly basis and 14% on an annual basis, compared to 12,234 transactions in July 2026 and 13,518 transactions in August 2025.
The number of duplex transactions reached 782, a monthly decrease of 4% and an annual decrease of 8%, compared to 818 transactions in July 2026 and 852 transactions in August 2025.
The number of deals in the round was 972, a monthly decrease of 1%, but an annual increase of 40%, compared to 981 deals in July 2026 and 694 deals in August 2025.
As for apartments, the number of transactions reached 5,051, a monthly decrease of 5% and an annual decrease of 15%, compared to 5,324 transactions in July and 5,949 transactions in August 2025.
Villas saw 2,248 transactions, down 6% per month, but up 21% per year, compared with 2,382 transactions in July and 1,857 transactions in August 2025.
The number of transactions classified under "other" reached 1,134 transactions, with a monthly growth of 3% and an annual increase of 83%, compared to 1,098 transactions in July and 621 transactions in August 2025.
Land trading value at 7.81 billion riyals
Land transactions amounted to approximately 7.81 billion riyals during August 2026, with a monthly decrease of 20% and an annual decrease of 22%, compared to 9,820,170,386 riyals in July 2026 and 9,947,766,688 riyals in August 2025.
The value of duplex transactions reached approximately 933 million riyals, a decrease of 5% per month and 12% per year, compared to 984,439,477 riyals in July and 1,057,998,085 riyals in August 2025.
As for the real estate deals, their value reached about 821 million riyals, a monthly decrease of 6%, despite an annual increase of 32%, compared to 873,036,106 riyals in July and 620,516,104 riyals in August 2025.
Apartments recorded approximately 3.15 billion riyals, a monthly decrease of 8% and an annual decrease of 20%, compared to 3,403,753,988 riyals in July and 3,941,333,745 riyals in August 2025.
The value of villa transactions reached approximately 3.03 billion riyals, declining by 14% monthly and 2% annually, compared to 3,524,644,254 riyals in July and 3,091,750,434 riyals in August 2025.
In contrast, the value of transactions classified under "other" rose to approximately 2.17 billion riyals, with a monthly increase of 79% and an annual increase of 140%, compared to 1,210,918,867 riyals in July and 903,223,437 riyals in August 2025.
Average sizes and values of residential transactions
The average area traded for land was 546 square meters during August 2026, a decrease of 2% per month and 1% per year, while the average area of duplexes was 290 square meters, a decrease of 3% per month and 2% per year.
The average floor area rose to 205 square meters, with a monthly growth of 1% and an annual growth of 2%, while the average apartment area reached 160 square meters, with a monthly increase of 1% despite a yearly decrease of 1%.
As for villas, the average traded area reached 463 square meters, with a monthly growth of 2% and an annual growth of 12%.
Regarding the average transaction value, the average value of a land transaction decreased to approximately 526,000 riyals, with a monthly decrease of 6% and an annual decrease of 11%.
The average value of a duplex transaction remained stable at around 1.17 million riyals, with no monthly change, and an annual decline of 5%.
The average value of a house transaction reached approximately 826,000 riyals, with a monthly decrease of 3% and an annual decrease of 5%, while the average value of an apartment transaction decreased to approximately 629,000 riyals, with a monthly decrease of 6% and an annual decrease of 6%.
The average villa transaction value was recorded at approximately SAR 1.30 million, a decrease of SAR 51,000 per month and SAR 221,000 per year. The report indicates that the "Other" category includes residential properties whose type was not specified by their source or which do not fall under the defined residential property types: land, duplexes, floors, apartments, and villas.
Riyadh leads in real estate deals
Riyadh region continued to lead administrative regions in terms of the number of real estate transactions during August 2026, after recording 6,623 transactions, accounting for 27,56% of the total real estate transactions.
The Makkah region came next with 5,489 transactions, representing 22,84% of the total, followed by the Eastern region with 3,685 transactions, representing 15,33%.
The Qassim region recorded 1,973 transactions, equivalent to 8.21%, while the Madinah region recorded 1,244 transactions, equivalent to 5.18%.
The total number of transactions in the five regions reached 19,014, representing 79,13% of the total real estate transactions during August 2026.
The value of deals in the five regions is 22.49 billion riyals.
In terms of the value of real estate transactions, Riyadh also topped the list with a value of 9,315,606,226 riyals, representing 38.17% of the total value of transactions during August 2026.
Makkah came in second place with a value of 7,159,445,499 riyals, with a percentage of 29.34%, followed by the Eastern Province with a value of 3,728,253,804 riyals, with a percentage of 15.28%.
Madinah recorded a transaction value of 1,716,799,107 riyals, representing 7.03%, while Al-Qassim recorded a transaction value of 569,151,689 riyals, representing 2.33%.
Thus, the total value of real estate transactions in the five regions amounted to approximately 22,489,256,325 riyals, equivalent to 92.15% of the total value of real estate transactions during August 2026.
Riyadh leads in rental transactions with 145,700 deals.
In the rental market, Riyadh topped the administrative regions in terms of the number of rental transactions during August 2026, recording 145,714 transactions, in which it acquired 32,65% of the total rental transactions.
Makkah came in second place with 112,589 transactions, representing 25.23%, followed by the Eastern Province with 69,885 transactions, representing 15.66%.
Madinah recorded 25,823 transactions, with a rate of 5.79%, while the Asir region recorded 22,172 transactions, with a rate of 4.97%.
The total number of rental transactions in the five regions amounted to 376,183 transactions, representing 84,29% of the total rental transactions during August 2026.
Rental transactions in the five regions amounted to 9.65 billion riyals.
In terms of the value of rental transactions, Riyadh also came out on top with a value of 4,515,375,515 riyals, accounting for 42.54% of the total value of rental transactions.
Makkah recorded 2,862,946,415 riyals, representing 26.97%, while the value of transactions in the Eastern Province amounted to 1,365,738,256 riyals, representing 12.87%.
The value of rental transactions in Madinah amounted to 555,042,767 riyals, representing 5.23%, while the Asir region recorded 350,279,199 riyals, representing 3.30%.
The total value of rental transactions in the five regions amounted to SAR 9,649,382,151, representing 90.90% of the total value of rental transactions during August 2026.
Growth in real estate brokerage licenses
Real estate market regulation data showed a disparity in the number of real estate brokerage activity licenses during August 2026 compared to July 2026 and August 2025. The new and renewed licenses include property management, facilities management, brokerage, marketing, consulting, real estate analysis and auction activities.
The number of property management facility licenses decreased to 221, a monthly decrease of 8%, with an annual increase of 50%, compared to 239 licenses in July 2026 and 147 licenses in August 2025.
Facilities Management Plant Licenses
The number of facility management licenses also decreased to 29 licenses, a monthly decrease of 6% and an annual increase of 81%, compared to 31 licenses in July and 16 licenses in August 2025.
In the real estate brokerage and marketing activity, the number of licenses for individuals increased to 9,818 licenses, with a monthly growth of 8% and an annual growth of 96%, compared to 9,130 licenses in July and 5,005 licenses in August 2025.
The number of establishment licenses remained stable at 3,044 licenses with no monthly change, with an annual increase of 8%, compared to 3,053 licenses in July and 2,806 licenses in August 2025.
Real Estate Consulting and Analysis Licenses
As for licenses for real estate consulting and analysis for individuals, they decreased to one license, with a monthly decrease of 95% and an annual decrease of 90%, compared to 22 licenses in July and 10 licenses in August 2025, while the number of licenses for establishments remained stable at 3 licenses with no monthly change.
In real estate auction activity, the number of establishment licenses decreased to 95 licenses, a monthly decrease of 14%, with an annual increase of 46%, compared to 110 licenses in July and 65 licenses in August 2025.
Real estate brokerage contracts show mixed trends.
Real estate brokerage contracts during August 2026 witnessed varying changes depending on the type of activity and the nature of the client, with increases recorded in a number of activities compared to the previous month and the previous year.
In sales brokerage contracts, the number of contracts for individuals rose to 349 contracts, with a monthly growth of 3% and an annual decline of 8%, compared to 339 contracts in July 2026 and 380 contracts in August 2025.
As for establishments, the number of sales brokerage contracts increased to 341 contracts, with a monthly growth of 4% and an annual growth of 9%, compared to 327 contracts in July and 312 contracts in August 2025.
In lease brokerage contracts, the number of contracts for individuals increased to 272 contracts, with a monthly growth of 15% and an annual growth of 25%, compared to 237 contracts in July and 217 contracts in August 2025. Meanwhile, the number of contracts for establishments decreased to 272 contracts, with a monthly decrease of 6% and an annual decrease of 2%, compared to 288 contracts in July and 277 contracts in August 2025.
As for marketing brokerage contracts, the number of contracts for individuals rose to 1,936 contracts, with a monthly growth of 7%, despite a yearly decline of 17%, compared to 1,804 contracts in July and 2,341 contracts in August 2025.
The number of marketing contracts for establishments increased to 16,143 contracts, with a monthly growth of 26% and an annual growth of 6%, compared to 12,819 contracts in July and 15,287 contracts in August 2025.
Increase in marketing, sales, and leasing contracts
The number of marketing and sales brokerage contracts for individuals increased to 7,165 contracts during August 2026, with a monthly growth of 9% and an annual growth of 16%, compared to 6,558 contracts in July and 6,196 contracts in August 2025.
The number of contracts for establishments also increased to 10,097 contracts, with a monthly growth of 14% and an annual growth of 4%, compared to 8,844 contracts in July and 9,706 contracts in August 2025.
In marketing and leasing brokerage contracts, the number of contracts for individuals increased to 3,815 contracts, with a monthly growth of 11% and an annual growth of 16%, compared to 3,428 contracts in July and 3,288 contracts in August 2025.
The number of facility contracts reached 10,250, with a monthly increase of 10% and an annual increase of 15%, compared to 9,311 contracts in July and 8,943 contracts in August 2025.
In contrast, the number of auction contracts decreased to 182 contracts, a monthly decrease of 28% and an annual decrease of 59%, compared to 254 contracts in July and 442 contracts in August 2025.
As for the other contracts, which include “tenant, buyer, consultants”, the number of contracts for individuals rose to 345 contracts, with a monthly growth of 10% and an annual growth of 28%, compared to 314 contracts in July and 269 contracts in August 2025.
As for the facilities, the number of other contracts was 692, a decrease of 7% per month, although an increase of 69% per year, compared to 748 contracts in July and 409 contracts in August 2025.
Real estate advertisements are rising monthly.
Real estate advertising data showed growth in August 2026 compared to July, with performance varying on an annual basis.
The number of sales ads reached 29,275 during August 2026, a monthly increase of 20%, despite a yearly decrease of 5%, compared to 24,299 ads in July 2026 and 30,878 ads in August 2025.
The number of rental ads also increased to 22,633, with a monthly growth of 7% and an annual growth of 6%, compared to 21,193 ads in July 2026 and 21,369 ads in August 2025.
Data sources and methodology for calculating indicators
The real estate asset trading data (“sales”) included in the bulletin is based on official data issued by the Ministry of Justice and the Real Estate Registry in the Kingdom of Saudi Arabia, and what is documented and recorded of real estate sales transactions during the reporting period.
As for the rental sector data, it is based on official data derived from the “Ejar” network, and what is documented and recorded from rental contracts and transactions during the reporting period.
The data on real estate brokerage activities, licenses and advertisements included in the report are based on official data approved by the Real Estate Brokerage Program of the General Authority for Real Estate, according to what is recorded and documented in the approved systems during the period covered by the report.
The report explains that the average transaction value and average traded volume are calculated using a systematic statistical process. The average transaction value is calculated by directly dividing the total value of transactions by the number of transactions during the month.
The averages are based on the data of the month being measured, in addition to the data of previous months, excluding outliers according to the standard deviation ±2 after logarithmic conversion, in addition to excluding any grouping of less than 5 transactions.