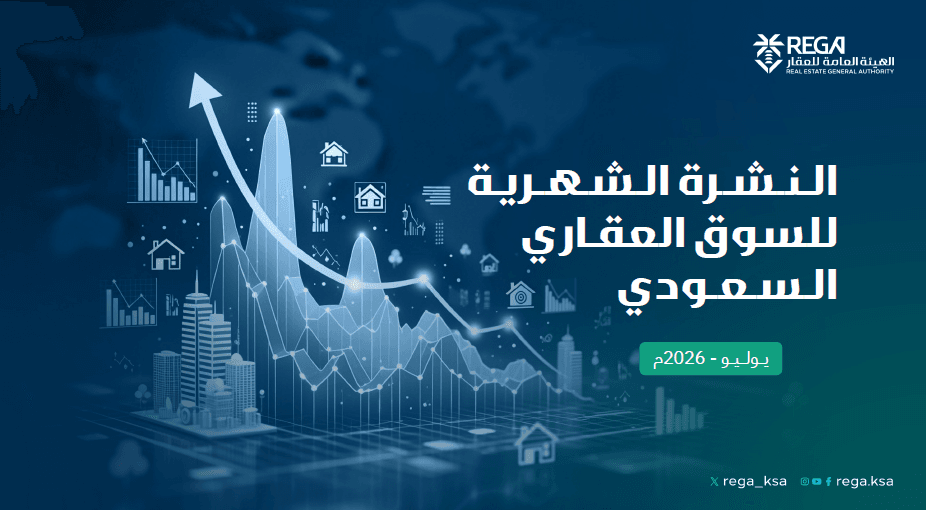

the Saudi real estate market a clear improvement in the pace of activity during July 2026, driven by a month-over-month increase in both the number and value of real estate transactions, along with notable growth in rental activity and an expansion of real estate brokerage services, according to data from the monthly bulletin issued by the General Real Estate Authority. The bulletin’s data for July reveals an improvement in a number of residential and non-residential transaction indicators, although some indicators continued to decline on a year-over-year basis.
The data shows that the market did not move in a single direction, as transaction performance varied by property type, and growth rates differed between sales and rentals, while the Kingdom’s major regions accounted for a significant share of total real estate activity.
Rise in Residential and Non-Residential Transactions in July
The number of residential real estate transactions in July 2026 to 22,837 transactions, compared to 19,844 transactions in June, representing a monthly growth of 15%, however, the number remained below the July 2025 level of 26,340 transactions, marking a year-over-year decline of 13%. As for non-residential transactions, the number rose to 2,314 in July, compared to 2,130 in June, representing a monthly increase of 9%, while the number decreased compared to 3,154 transactions in July 2025, marking a year-over-year decline of 27%.
In terms of transaction value, the value of residential transactions in July reached approximately 19.82 billion riyals, up by 32% compared to June, which recorded approximately 15.02 billion riyals, but it fell by 43% year-over-year compared to approximately 35.04 billion riyals in July 2025. As for non-residential transactions, their value reached approximately 15.72 billion riyals in July, a significant monthly increase of 82% compared to approximately 8.65 billion riyals in June, while they fell by 7% year-over-year compared to approximately 16.88 billion riyals in July 2025. The bulletin notes that the monthly increase in the value of non-residential transactions was driven primarily by a limited number of high-value transactions.
Area and Average Transaction Value
The average area traded in residential transactions during July rose to approximately 419 square meters, a monthly increase of 2%, with a slight year-over-year increase of 1%. In the non-residential sector, the average traded area rose to approximately 31,995 square meters, recording monthly growth of 3% and a year-over-year increase of 7%. The average value of a residential transaction reached approximately 715,000 riyals in July, marking a monthly increase of 1%, but it declined by 2% year-over-year. In non-residential transactions, the average reached approximately 2.03 million riyals, marking a monthly increase of 8%, compared to a year-over-year decline of 31%.
Rental Market Records Broad Growth
The improvement in real estate activity was not limited to sales; July data also showed significant growth in the rental market. The number of residential lease agreements in July 2026 to 284,044, compared to 260,103 in June, representing a monthly growth rate of 9%, and a 27% increase compared to 223,780 contracts in July 2025.
In the non-residential rental sector, the number of contracts rose to 71,906, compared to 68,244 in June, representing a monthly growth of 5%, and a year-over-year increase of 33% compared to 54,069 contracts in July of the previous year. In terms of the number of lease transactions, residential transactions rose to 315,853 in July, with a monthly growth rate of 9% and a yearly growth rate of 25%. Non-residential transactions also rose to 102,069, with a monthly increase of 5% and a year-over-year growth of 29%.
In contrast, the value of residential lease transactions reached approximately 5.59 billion riyals, marking a monthly increase of 10% and a yearly increase of 28%. Meanwhile, the value of non-residential transactions stood at approximately 5.01 billion riyals, down 16% on a monthly basis, despite a 21% increase compared to July 2025.
Land Leads Residential Real Estate Transactions
Data on residential real estate transactions revealed that land led in terms of transaction volume during July 2026. The number of land transactions reached 15,279 in July, compared to 11,175 in June and 12,234 in July 2025, representing a monthly growth of 9%, with a year-over-year decline of 20%. Duplex transactions totaled 830 in July, compared to 719 in June and 818 in July 2025, representing a monthly increase of 14% and a slight year-over-year decline of 1%.
As for single-story homes, transactions totaled 696, compared to 772 in June and 981 in July 2025, marking a monthly decline of 27%, despite a year-over-year increase of 41%. Apartments recorded 5,890 transactions in July, compared to 4,499 in June and 5,324 in July 2025, marking a monthly increase of 18%, compared to a year-over-year decline of 10%.
The number of villa transactions also rose to 1,916, compared to 1,793 in June and 2,382 in July 2025, representing a monthly increase of 33%, and a year-over-year decline of 24%. The "other residential properties" category recorded 1,729 transactions, a monthly increase of 24% and a year-over-year decline of 36%.
Value of Residential Transactions by Property Type
Land accounted for the largest share of residential transaction value, with the value of transactions reaching approximately 9.82 billion riyals in July 2026—up 35% from June but down 15% from July 2025.
The value of duplex transactions reached approximately 984.4 million riyals, representing a monthly increase of 22% and a year-over-year decline of 10%.
As for multi-story units, transactions totaled approximately 873 million riyals, marking a monthly increase of 32% and annual growth of 39%.
The value of apartment transactions reached approximately 3.40 billion riyals, up 21% on a monthly basis but down 13% year-over-year.
Transactions for villas totaled approximately 3.52 billion riyals, marking a significant monthly increase of 54%, along with a year-over-year decline of 3%.
As for properties classified under the "Other" category, the value of transactions reached approximately 1.21 billion riyals, marking a monthly increase of 5% and a sharp annual decline of 91%.
Average Area Figures Reveal Differences Among Property Types
The average area of land traded in July was approximately 558 square meters, marking a monthly increase of 4% and a yearly rise of 2%.
The average area of duplexes stabilized at approximately 299 square meters, with virtually no monthly change and a slight annual decrease of 1%.
The average floor area fell to 203 square meters, a monthly decline of 3%, with an annual increase of 1%.
The average apartment size also fell to 158 square meters, a monthly decrease of 2% and a yearly decrease of 4%.
In contrast, the average area of a villa was approximately 454 square meters, down 1% on a monthly basis but up 10% year-over-year.
As for other properties, their average size fell to 232 square meters, a monthly decrease of 9% and an annual decline of 38%.
Average Value of Residential Transactions
The average value of a land transaction was approximately 559,700 riyals in July, a monthly decrease of 4% and a year-over-year decline of 7%.
The average transaction value for duplexes rose to approximately 1.18 million riyals, a monthly increase of 5%, with a year-over-year decline of 12%. The average transaction value for single-story homes was approximately 847.5 thousand riyals, down 3% month-over-month and 2% year-over-year.
For apartments, the average was approximately 668,100 riyals, a monthly increase of 4%, with relative stability on a year-over-year basis.
The average transaction value for villas reached approximately 1.37 million riyals, a monthly increase of 5%, despite a year-over-year decline of 20%.
The "Other Real Estate" category recorded an average of approximately 815,600 riyals, a monthly increase of 12% and a significant annual increase of 74%.
Riyadh Accounts for the Largest Share of Real Estate Transactions
The Riyadh region solidified its position as the Kingdom’s largest real estate trading hub in July 2026, both in terms of the number of transactions and their value.
The region recorded 7,670 real estate transactions, accounting for 30.50% of the total transactions. The Makkah region came in second with 5,279 transactions, representing 20.99% of the total, followed by the Eastern Province with 3,722 transactions, accounting for 14.80%.
The Qassim region recorded 1,967 transactions, equivalent to 7.82% of the total, while transactions in Madinah totaled 1,254, with a share of 4.99%.
Thus, the total number of transactions across the five regions reached 19,892, representing 79.09% of the total real estate transactions recorded in July 2026.
In terms of transaction value, Riyadh also led the way with a value of approximately 15.68 billion riyals, representing 44.12% of the total value of real estate transactions.
Mecca ranked second with a transaction value of approximately 10.09 billion riyals, accounting for 28.39%, followed by the Eastern Province with approximately 4.13 billion riyals and a share of 11.62%.
Medina recorded approximately 2.84 billion riyals in transaction value, representing 8%, while the value of transactions in Al-Qassim reached approximately 566.9 million riyals, accounting for 1.60%.
Thus, the value of transactions in the five regions reached approximately 33.30 billion riyals, equivalent to 93.72% of the total value of real estate transactions in the Kingdom during July.
Rents... Riyadh, Mecca, and the Eastern Province Lead the Market
Riyadh continued to lead the rental market in terms of the number of transactions, recording 136,054 rental transactions in July, accounting for 32.55% of total rental transactions.
Mecca came in second with 112,695 transactions, accounting for 26.97%, followed by the Eastern Province with 65,918 transactions, representing a 15.77% share.
Medina recorded 26,452 lease transactions, accounting for 6.33%, while transactions in the Asir region totaled 17,872, accounting for 4.28%.
The total number of transactions in these five regions reached 358,991, representing 85.90% of the total rental transactions during July 2026.
In terms of value, Riyadh also led the way with rental transactions totaling approximately 4.43 billion riyals, accounting for 41.75% of the total value of rental transactions.
Mecca recorded approximately 2.96 billion riyals, representing 27.96%, while the value of transactions in the Eastern Province reached approximately 1.40 billion riyals, accounting for 13.23%.
The value of lease transactions in Madinah reached approximately 593 million riyals, accounting for 5.59%, while Asir recorded approximately 304.3 million riyals, accounting for 2.87%.
The total value of lease transactions across the five regions reached approximately 9.69 billion riyals, representing 91.41% of the total value of lease transactions in the Kingdom during July.
Expansion in Real Estate Brokerage and Services Licenses
Data from the Real Estate Market Regulatory Authority showed growth in the number of licenses related to real estate brokerage and services in July 2026, reflecting the expansion of the base of regulated activities in the market.
The number of property management facility licenses rose to 239, representing a monthly growth of 43% and a year-over-year increase of 12%.
The number of licenses for facilities management companies also rose to 31, with a monthly growth rate of 29% and an annual growth rate of 15%.
In the real estate brokerage and marketing sector, the number of individual licenses rose to 9,130, representing a monthly increase of 65% and a yearly increase of 52%, while the number of licenses for businesses rose to 3,053, with a monthly growth of 46% and an annual growth of 11%.
As for real estate consulting and analysis licenses for individuals, they rose to 22, with a monthly growth of 120% and an annual growth of 47%, while the number of facility licenses reached 3, with a monthly increase of 200% and an annual increase of 50%.
In the real estate auction sector, the number of facility licenses rose to 110, with a monthly growth rate of 24% and an annual growth rate of 47%.
Real Estate Brokerage Contracts: Variations Between Sales, Rentals, and Marketing
Real estate brokerage contracts showed mixed performance in July compared to the previous month.
The number of sales brokerage contracts for individuals remained stable at 339, with virtually no change on a monthly basis, but rose by 22% compared to July 2025.
As for sales brokerage contracts for commercial properties, they totaled 327, marking a monthly increase of 3% and a yearly increase of 32%.
In lease brokerage, the number of contracts concluded for individuals fell to 237, a monthly decrease of 14% and a yearly decrease of 7%, while contracts for businesses fell to 288, a monthly decline of 5%, despite a 6% increase year-over-year.
As for marketing brokerage contracts for individuals, the number fell to 1,804 contracts, a monthly decrease of 4% and a yearly decrease of 10%, while the number of contracts for businesses rose to 12,819, representing a monthly increase of 25% and a yearly increase of 20%.
Marketing and sales brokerage contracts for individuals totaled 6,558, representing a monthly increase of 3% and a yearly increase of 28%, while contracts for businesses totaled 8,844, a monthly decrease of 1% but a yearly increase of 3%.
In marketing and leasing brokerage, the number of contracts for individuals fell to 3,428, a monthly decrease of 2%, with a year-over-year increase of 4%, while contracts for businesses remained stable at 9,311, with virtually no monthly change and a year-over-year increase of 7%.
Auction contracts for businesses also fell to 254 contracts, a monthly decrease of 23%, despite an annual increase of 8%.
As for other contracts, which include activities such as buyer, tenant, and consulting, the number of individual contracts remained stable at 314, with virtually no monthly change, and an annual increase of 23%, while the number of contracts for commercial properties fell to 748, a monthly decline of 1% and a significant annual increase of 64%.
Real Estate Listings Show Monthly Growth
Real estate listing data showed continued growth in activity during July 2026, as the number of for-sale listings rose to 24,299, compared to 21,567 in June, representing a monthly increase of 13%, although the number was down 3% compared to July 2025, which recorded 25,037 listings.
The number of rental listings also rose to 21,193, compared to 20,649 in June, marking a monthly increase of 3%, and a year-over-year increase of 3% compared to 20,492 listings in July 2025.